Research Highlights · Heat attribution and children’s exposure
School is back, but the heat remains: children’s exposure in a warming climate
Overview
This study connects extreme-heat attribution with children’s exposure, showing that human-induced climate change has made autumn heatwaves like the one during school reopening in 2024 more likely and more intense, while increasing children’s exposure. The child population is projected to decline as heat intensifies, with these opposing changes shaping total exposure. Even where fewer children bring the total down, those living and attending school in the region will face more frequent and intense heat at the start of the school year.
Background
Schools in many regions reopen in early autumn, after the hottest part of summer has usually passed. Recent autumn heatwaves, however, have begun to disrupt that schedule. In September 2024, persistent heat affected China’s Yangtze River basin, with temperatures above 40°C in Sichuan, Chongqing and parts of Hunan and Zhejiang. Some cities delayed reopening or suspended outdoor activities, and students still suffered heatstroke. The calendar had moved into September, but the summer heat had stayed.
The event lasted through 1–10 September. The regional mean daily maximum temperature anomaly reached about 5.02°C, the highest for that period since 1959 and nearly 1.5 times the previous record set in 1995. For children returning to school, the start of term had become another period of substantial heat exposure.
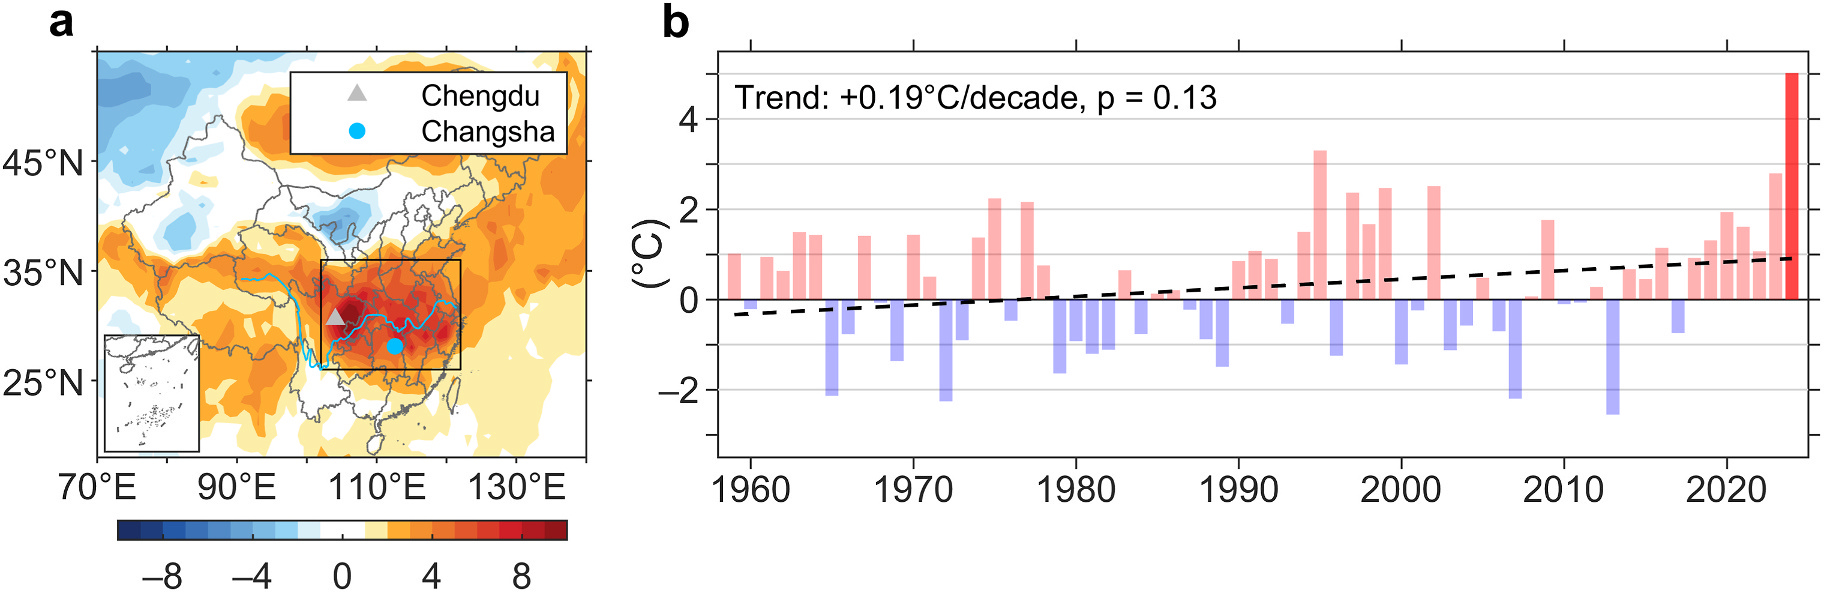
We wanted to bring weather, climate and population into the same analysis: first explaining why this heatwave was so intense, then estimating how similar events might change, and finally combining those changes with the distribution of children to assess their exposure.
Methods
We measured event intensity as the Yangtze River basin’s mean daily maximum temperature anomaly during 1–10 September, relative to the same period in 1961–1990. Within a combined storyline–probability framework, constructed flow analogues estimated the contributions of circulation, dry soils and background warming to the specific event. A probability-based analysis using six CMIP6 models compared climates with and without human influence to estimate changes in the likelihood of similar heat and the intensity of equally rare events.
Circulation and dry soils are connected: high pressure, reduced rainfall and stronger sunshine can dry the land surface. To reduce double counting, we first estimated the effect of circulation, including the soil drying associated with it, and then analysed the remaining soil moisture anomaly. The soil contribution reported below therefore represents this additional effect after removing the circulation-related component.
Children’s exposure was calculated as the population aged 0–14 multiplied by heatwave intensity, in person·°C, combining how many children are exposed with how intense the heat is. Vulnerability was held constant to focus on climate and population changes, so this is an exposure indicator rather than a count of heatstroke cases or health losses. Changes in exposure were separated into contributions from heat intensity, child population and an interaction term capturing their simultaneous changes.
Future projections compared SSP1-2.6, SSP2-4.5 and SSP5-8.5 against the 2024 climate. Climate periods were represented by 21-year windows, including 2014–2034 for 2024 and 2080–2100 for the end of the century. Child population estimates combined the total population under each pathway with the share of children in China from the UN’s medium population projection.
Results
An unusually strong high-pressure system dominated the Yangtze River basin, accompanied by a westward extension of the western Pacific subtropical high. Persistent descending air, fewer clouds, less rainfall and stronger sunshine sustained the heat. Dry soils further reduced evaporative cooling, leaving more energy to warm the air near the surface.
ERA5 reconstructions attributed about 48% of the event’s intensity to large-scale circulation and 23% to the remaining soil moisture anomaly. With similar circulation held in place, a comparison of past and more recent climates gave a background warming contribution of about 25%. The study interpreted this difference mainly as human-induced warming and tested that interpretation using CMIP6 simulations with and without anthropogenic forcing, which gave a thermodynamic contribution of about 30%. Circulation and dry soils shaped the event, while a warmer background raised temperatures further.
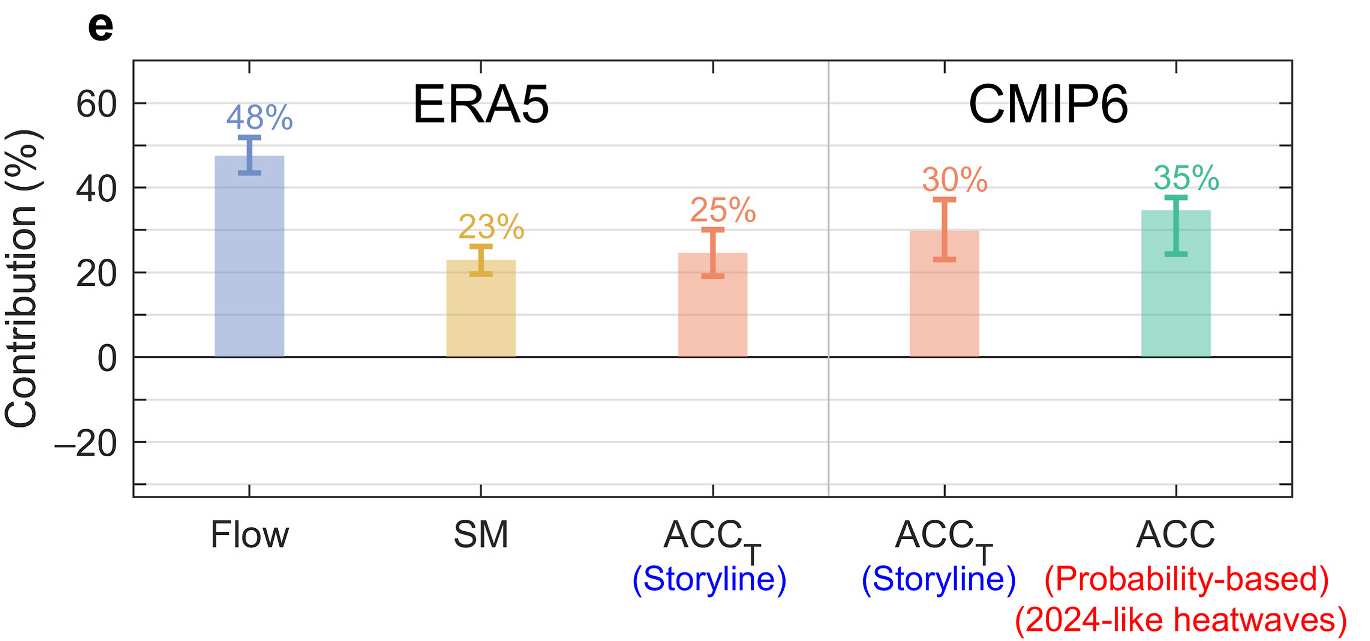
The probability-based comparison showed an even larger human influence on how often similar heat occurs. In the 2024 climate, CMIP6 estimated that human-induced climate change made such autumn heatwaves about 514 times as likely as without human influence and increased the intensity of equally rare events by about 2.1°C. The probability ratio has an uncertainty range of roughly 190–1327, illustrating the spread in estimates for such rare events. Holding the 2024 population distribution fixed, children’s exposure rose from about 538 million person·°C to 834 million person·°C, an increase of about 55%.
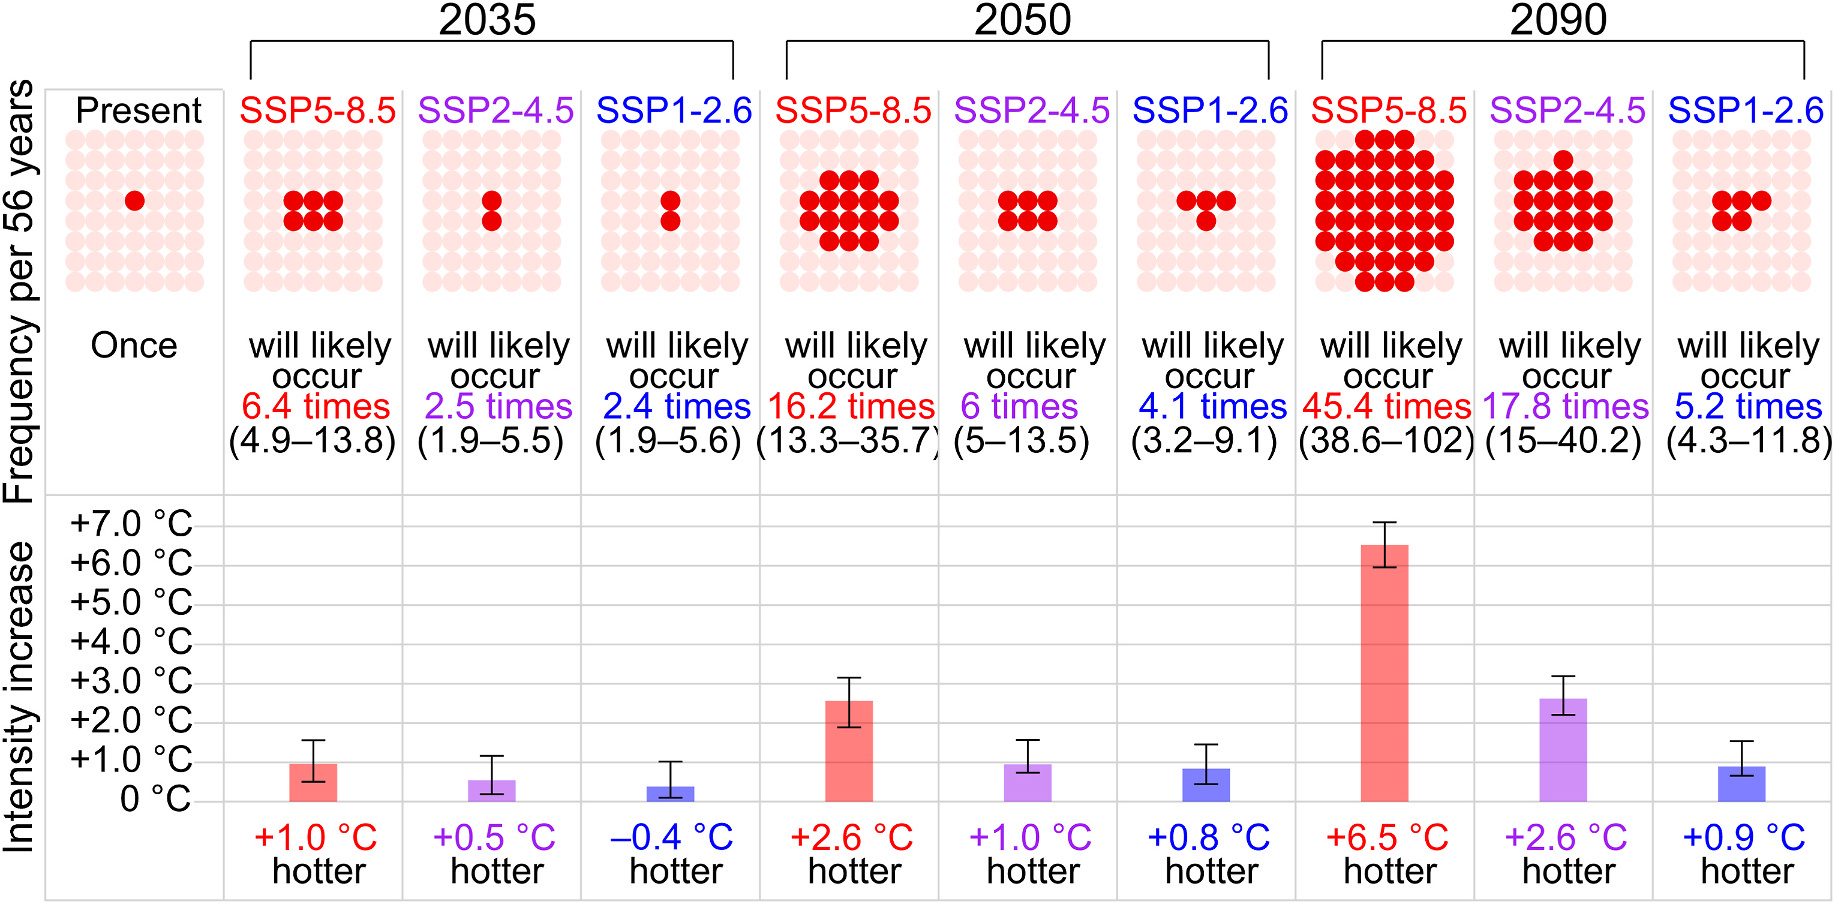
Similar heat at the start of the school year intensifies under all three future pathways, with the differences growing over time. Toward the end of the century, relative to the 2024 climate, event probability reaches about 5.2 times the baseline under SSP1-2.6, with an intensity increase of 0.9°C. Under SSP2-4.5, the corresponding changes are 17.8 times and 2.6°C; under SSP5-8.5, 45.4 times and 6.5°C. Emissions cuts substantially limit the increase, although even the lower-emissions pathway brings hotter conditions than in 2024.
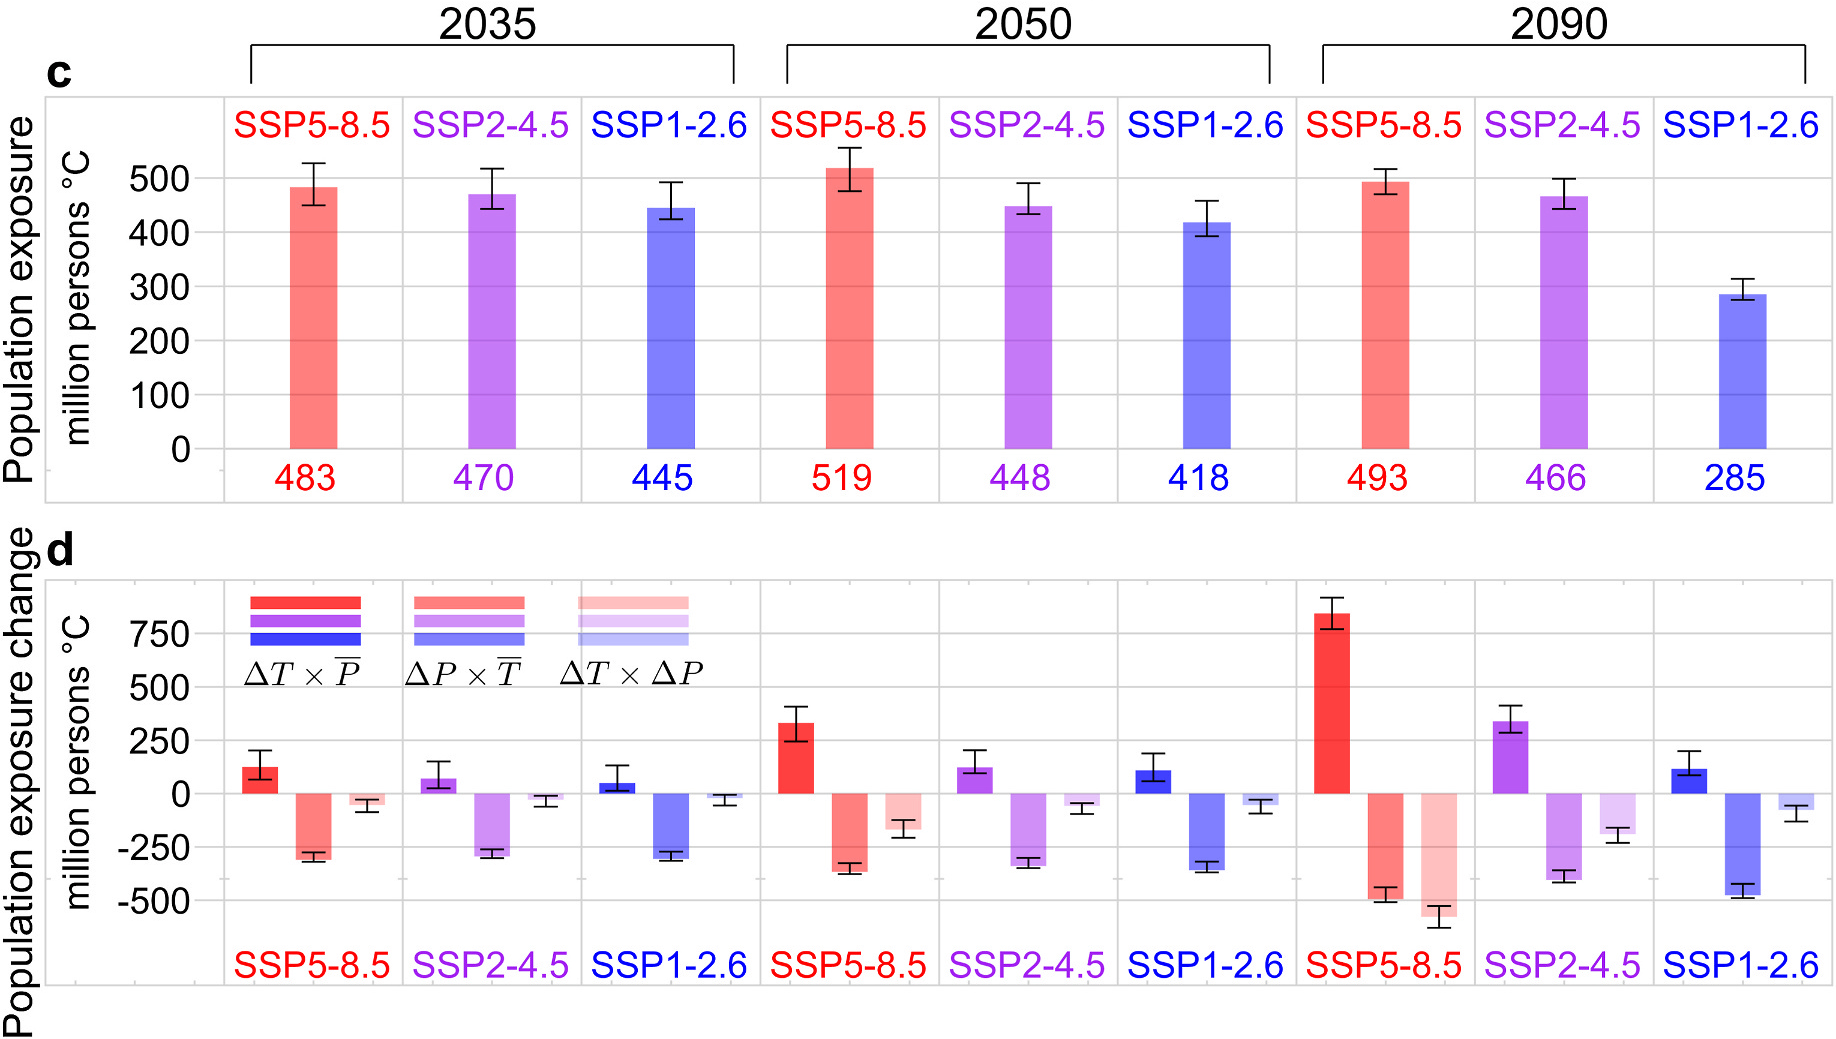
Adding population change produces a more varied picture of total exposure. A declining child population pulls the total down, while stronger heat pushes it up. Under SSP1-2.6, population decline dominates throughout: total exposure falls from about 445 million person·°C in 2035 to 418 million person·°C in 2050 and 285 million person·°C in 2090.
Under SSP2-4.5, exposure first falls from about 470 million person·°C to 448 million person·°C, then rises to 466 million person·°C toward the end of the century as intensifying heat increasingly offsets the population decline. Under SSP5-8.5, stronger heat has a larger influence, with exposure of about 483, 519 and 493 million person·°C across the three periods, rising and then falling. These future totals all remain below the 2024 estimate, but late-century exposure is substantially lower under the low-emissions pathway than under the other two.
Discussion
Total exposure and the heat itself can move in different directions. Fewer children can reduce the population-times-intensity total, while those still attending school in the region face stronger heat and more frequent events. Looking separately at population numbers and the changing heat hazard makes it easier to see why adaptation remains necessary even when aggregate exposure falls.
School arrangements will also need to respond more flexibly to a changing climate. As heat increasingly extends into early autumn, existing calendars may no longer avoid the hottest conditions as effectively as before. The study discusses adjusting reopening dates and outdoor activities using forecasts, improving classroom cooling and temporarily moving lessons online where needed. Applying these ideas to individual schools requires local calendars, indoor temperatures and the time children actually spend outdoors.
The differences between pathways show the value of both emissions cuts and adaptation in schools. Mitigation limits how much stronger future heat becomes, while adaptation improves the conditions in which children learn and live during hot weather. A population-driven fall in total exposure cannot replace those practical protections.
Behind the scenes
I finished the first draft at the end of 2024 and tried hard to recreate the IPCC’s figure style, especially for the future projections. For various reasons, though, we only began submitting the paper after I graduated in 2025. It finally went out for review at WCE at the end of that year, bringing some much-needed feedback from colleagues.
The three reviewers focused on quite different aspects. One wanted a clearer explanation of the storyline–probability attribution framework; another paid close attention to the writing and the rhythm of the article; the third focused on population exposure and offered specific suggestions for separating the contributions. Early in the winter break, I had to put my postdoctoral work aside for a while and stay up late working through the replies and revisions. Fortunately, the paper was accepted after one round of revision.
Its publication meant something special to me: it marked the completion of all the work I had carried out during my PhD.