Research Highlights · Storyline and probability-based attribution
Why can extreme rainfall become more likely without more rain on average?
Overview
This study looks at the record-breaking persistent rainfall in southwestern China in August 2020 from two angles: why was this particular event so intense, and have human activities changed the probability of similar events? Large-scale circulation explained about 47% of the event’s intensity, while human influence made rainfall at least this intense about 2.4 times as likely. The striking part is that this increase in probability was mainly associated with greater rainfall variability, meaning larger swings from year to year, rather than a steady increase in average rainfall. Extreme rain can become more likely even without a clear long-term trend.
Background
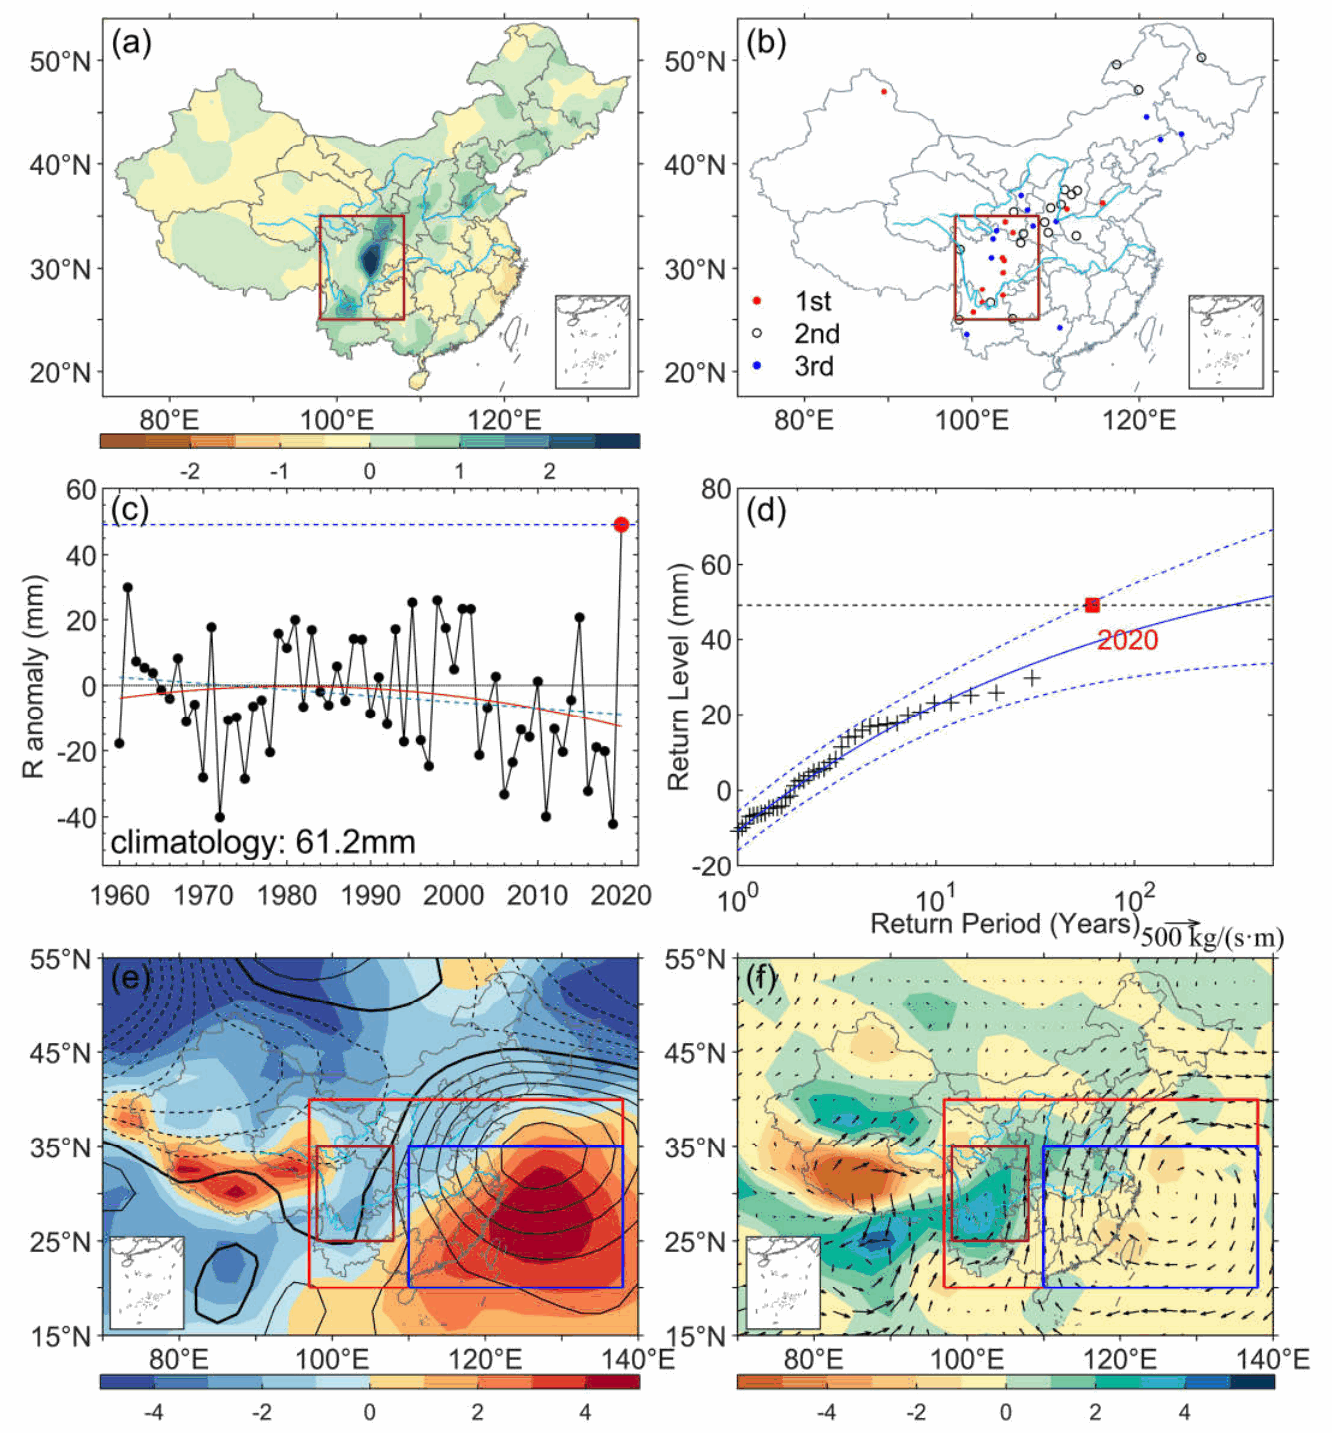
From 11–20 August 2020, the Sichuan Basin and surrounding areas experienced an exceptionally persistent spell of heavy rain. It was listed among China’s ten major weather and climate events and ten major natural disasters that year. The regional rainfall anomaly over those 10 days was the largest since 1960, reaching about 2.5 standard deviations. Several stations in the basin broke their daily rainfall records; Lushan recorded 425.2 mm in a single day, more than twice its previous record. The relentless rain triggered flooding, waterlogging, and landslides, causing severe losses.
Understanding this event takes more than knowing that a lot of rain fell. Southwestern China is influenced by the East Asian summer monsoon, and its rainfall depends strongly on the subtropical high, moisture transport, and the weather patterns of the day. Natural fluctuations are already large, and previous attribution studies of heavy rainfall in China had even found human influences acting in different directions. We therefore separated two questions: how much of this event could the unusual circulation explain, and had human activities changed the probability of similar events?
Methods
For the first question, we took a storyline approach, following this particular event to understand its causes. Using flow analogues, we found historical days with large-scale weather patterns similar to those in 2020, then used their rainfall to reconstruct the event. We also compared the results with randomly selected weather patterns and allowed for circulation persisting for several days, so that its persistence was not overlooked.
The second question needed a different approach. Comparing the past with the present can reveal the role of a changing climate background, but cannot isolate the human contribution. We therefore used the UK Met Office’s HadGEM3-GA6-N216 attribution system to compare two sets of simulations for 2020, with 525 members each: one with human influence and one without it. Think of these as many possible weather outcomes in the world we live in and in an imagined world with human influence removed. Comparing how often rainfall reaches the same threshold is the probability-based part of the analysis.
Results
The event’s weather pattern offered a clear starting point. The study region lies along the eastern edge of the Tibetan Plateau and was west of an unusually strong and persistent western Pacific subtropical high. Moisture from the south was repeatedly transported into the Sichuan Basin and nearby areas, where it converged, providing ample moisture and favorable circulation for persistent heavy rain.
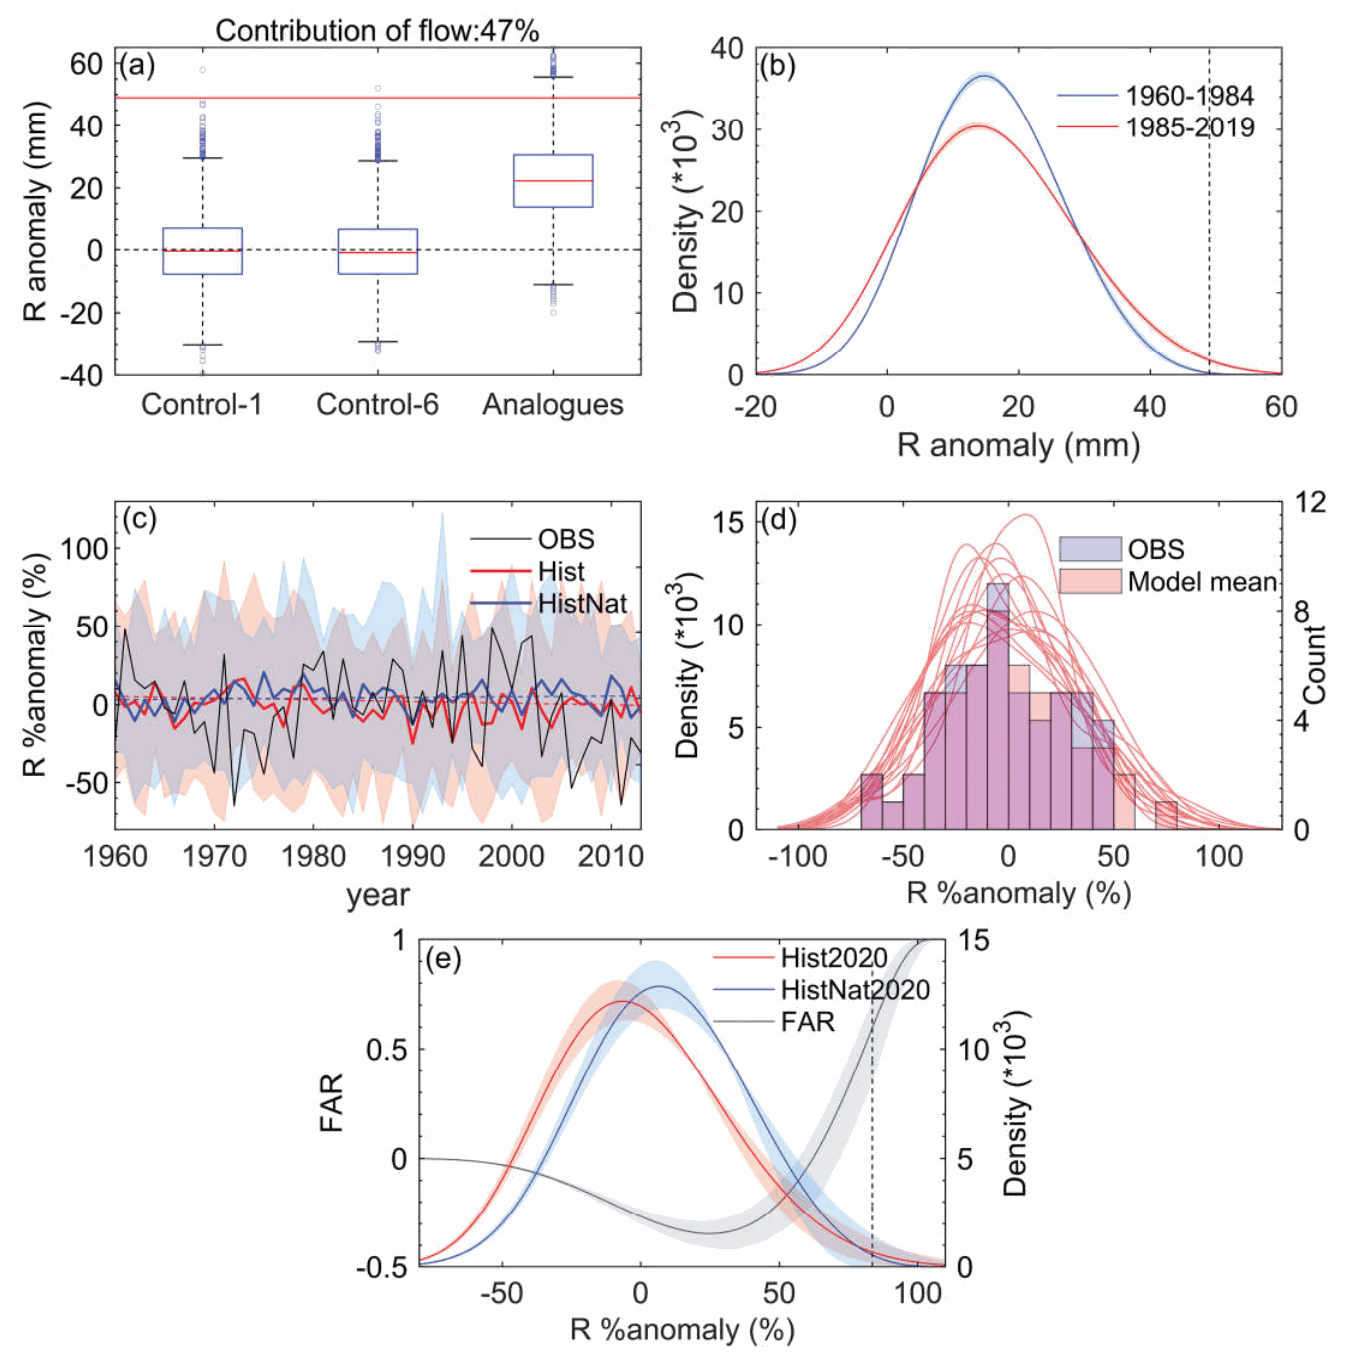
The analogue analysis confirmed the importance of that pattern. With randomly selected historical weather patterns, rainfall reaching the 2020 intensity was almost absent from the reconstructed samples. Choosing circulation similar to the event produced much heavier rain, yet the observed intensity remained rare even among these samples.
After accounting for circulation persistence, large-scale circulation explained about 47.2% of the observed event’s intensity. It was clearly an important part of the explanation, but accounted for only about half. Saying that the weather pattern was unusual does not fully explain why the rain was so extreme. Nor can we simply assign the remainder to human influence: factors such as soil moisture, which the analogue method did not separately account for, may also have played a role.
Comparing similar circulation across different periods also revealed a signal of climate change: analogues from the more recent period were more likely to produce large rainfall anomalies. To go further and identify the human contribution, however, we needed the simulations with and without human influence.
Those simulations showed that human influence made rainfall reaching or exceeding the 2020 intensity about 2.4 times as likely, with a fraction of attributable risk (FAR) of about 0.59. This probability ratio (PR) compares the two simulated worlds for this region, time of year, and intensity threshold. It describes the chance of similar heavy rainfall, not a 2.4-fold increase in the amount of rain during the event. It also cannot be added to the circulation contribution above, which measures a share of the event’s intensity.
Discussion
Figure 2 contains another result that is easy to miss. If human influence made heavy rain more likely, does that mean the region had been getting steadily wetter? In fact, average rainfall for 11–20 August showed a slight, statistically insignificant decline from 1960 onward. The simulated response to human influence also tended to reduce regional mean rainfall.
So why would extreme rainfall become more likely without more rain on average? The key was larger swings in rainfall. In the simulations, human influence increased year-to-year variability, widening the probability distribution. Even without the average moving toward wetter conditions, the heavy-rainfall end could extend farther, making previously rare events more common. Extreme rainfall can become more likely even when average rainfall does not increase.
This is one of the interesting complications of rainfall attribution. For heat, a rising average and stronger extremes usually point in the same direction. Rainfall need not behave that way: a region without a clear long-term wetting trend can still experience a higher probability of extreme rainfall if the swings between years grow larger. Looking only at a trend line can miss what is happening at the far end of the distribution.
The study also builds on our earlier work on the 2020 Meiyu rainfall and South China heat. That study compared past and present climates under similar circulation; here, we went further by adding simulations with and without human influence. Asking why this particular event occurred and how human activities changed the probability of similar events gives us two different, complementary views.
Understanding changes in extreme rainfall therefore means asking more than whether average rainfall will increase. Could the swings between years grow larger? Could previously rare downpours become more common? Unusual circulation helps explain why this event occurred at this time and place, while climate change can make similar events more likely by changing rainfall variability. Many changes never show up clearly in the average.
Behind the scenes
I started this study around spring and summer of my second year as a graduate student. The paper was short, but the workload certainly was not. My schedule was packed with classes, often during both the day and evening, and I would return to the dormitory to carry on coding and analyzing data. It was a stressful stretch, but I eventually managed to finish all the coding, analysis, and figures.